This article may reference legacy company names: Continental Mapping, GISinc, or TSG Solutions. These three companies merged in January 2021 to form a new geospatial leader [Axim Geospatial].
You’ve just finished installing and configuring your ArcGIS Enterprise site. You’ve got services, maps, and apps published and your organization is making use of them. Perhaps some of these apps or services are mission critical to your organization and you want to make sure they’re working great. What now? How do you make sure you’ve got enough resources dedicated to your site? How do you ensure that these important services and apps are available when they are needed? How do you find out if something goes wrong? These are important questions and with a default ArcGIS Enterprise installation, it can be difficult to obtain the information you seek. What you need is some way of proactively checking up on your site, preferably with some mechanism that notifies you if something is wrong. This is where server monitoring comes in.
Server monitoring can take the form of a set of simple utilities that tell you the basic health of your system, it can be a comprehensive GIS-server-specific suite of tools with reporting and advanced notification, or somewhere in between. This post will briefly discuss a few options that we at Axim has had experience with.
On the light-weight end of the spectrum is a set of Python scripts developed by Axim that captures basic system health statistics such as CPU, RAM, disk space usage, and status of ArcGIS Server map services. These scripts run as scheduled tasks at intervals determined by you and are stored in a database that can be used to generate reports or presented in a service that can be consumed by an ArcGIS Dashboard for live viewing of the data.
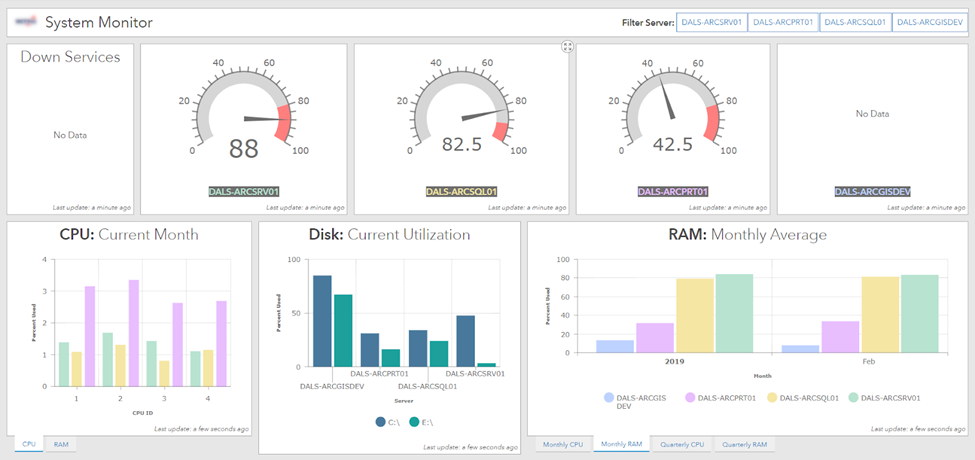 An ArcGIS Operations Dashboard hosted on an ArcGIS Enterprise site showing collected monitoring data
These light-weight scripts require minimal system resources to run, and can be configured to notify you via email in the event that RAM, CPU, or Disk space usage exceed user-defined thresholds--and can also notify you if one or more ArcGIS Server services are unresponsive.
On the opposite end of the server monitoring spectrum is a full-featured, GIS-Server-Specific server monitoring system. The most comprehensive and powerful system currently available that is specific to monitoring GIS Servers is Esri’s ArcGIS Monitor. ArcGIS Monitor includes a full suite of tools to allow you to analyze the performance of your systems, help you monitor the health of the systems, notify you of issues or problems as they occur, and view reports. Access to these tools is provided through an easy-to-use web browser interface that displays information in real time, and all the tools have been designed and optimized to provide the best GIS-specific insight into the performance of your site. Additional plug-in style tools can be added to customize the behavior and capabilities of ArcGIS Monitor so you can configure it to answer most any question you may have about your ArcGIS Enterprise site investment.
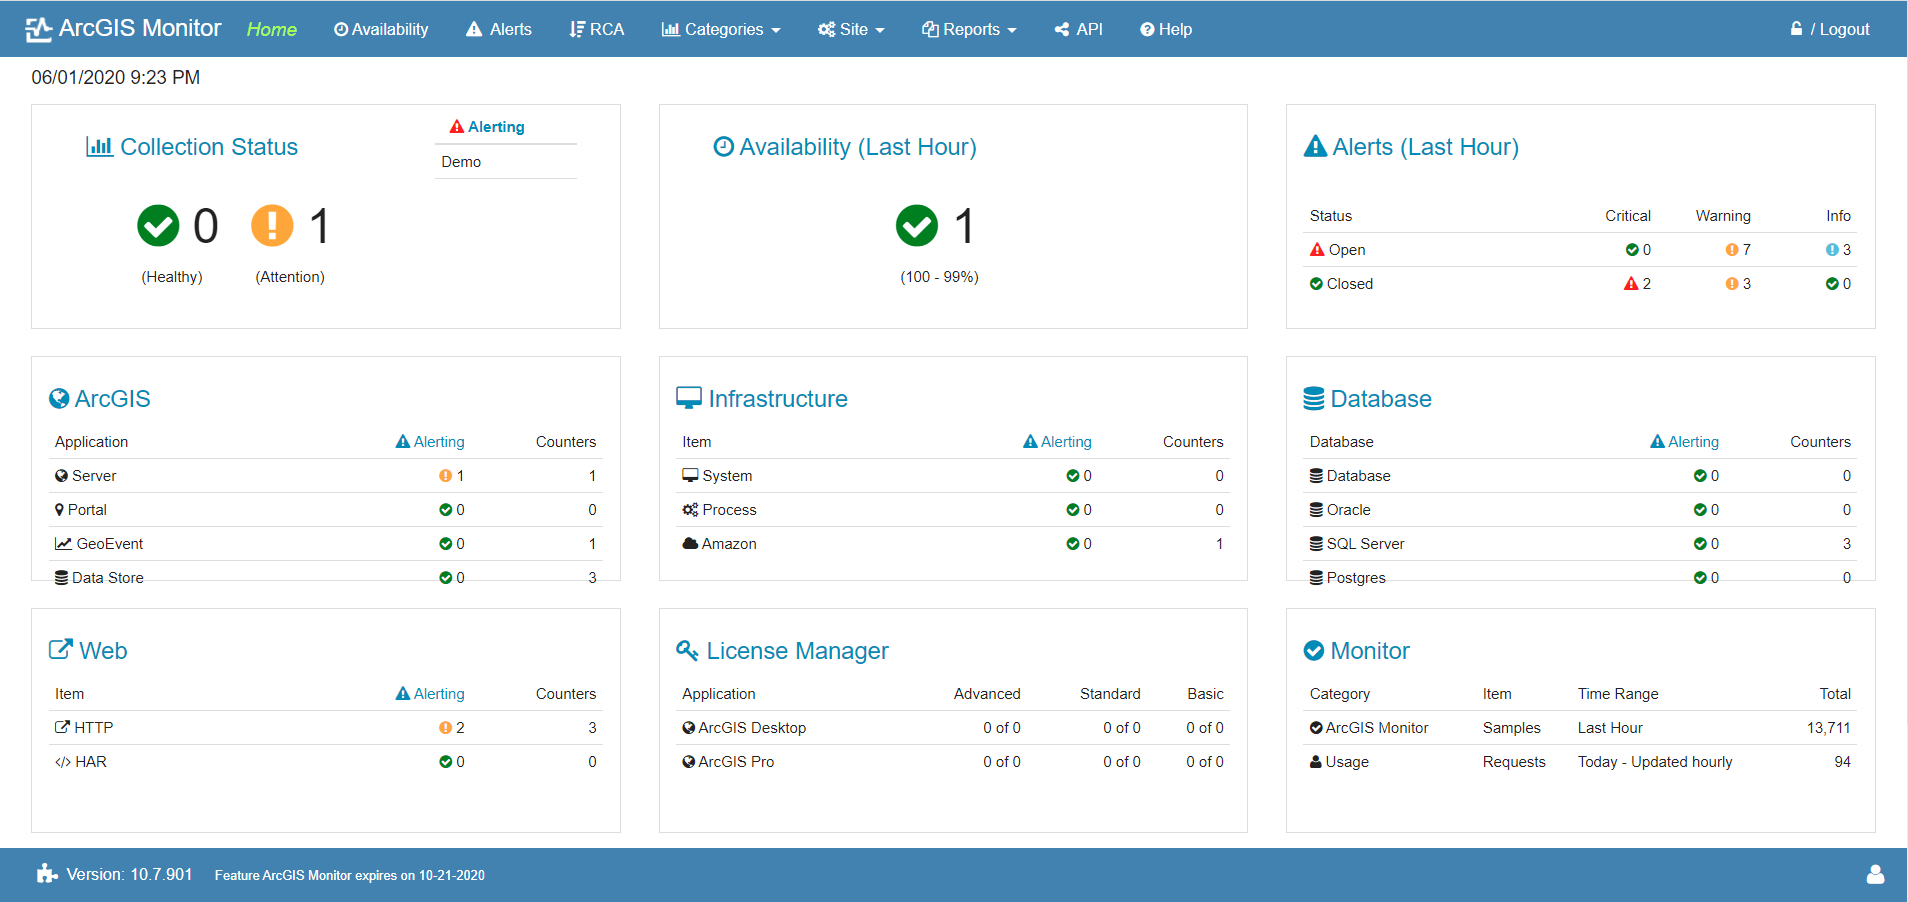
Esri’s ArcGIS Monitor Dashboard
At Axim, we have found that many users fall somewhere in between these two ends of the server monitoring spectrum. The basic server monitoring script tools may be a little too basic, but perhaps the ArcGIS Monitor solution is a bit too comprehensive or budget may not allow for the acquisition of a high-end GIS-specific monitoring solution. There are numerous options between these ends of the spectrum, ranging from free/open-source monitoring software packages to fully paid, non-GIS-specific software designed specifically for monitoring the health of servers and network performance. Of the solutions available, one that has offered a beneficial balance of capability and reasonable cost is Paessler’s PRTG Network Monitor.
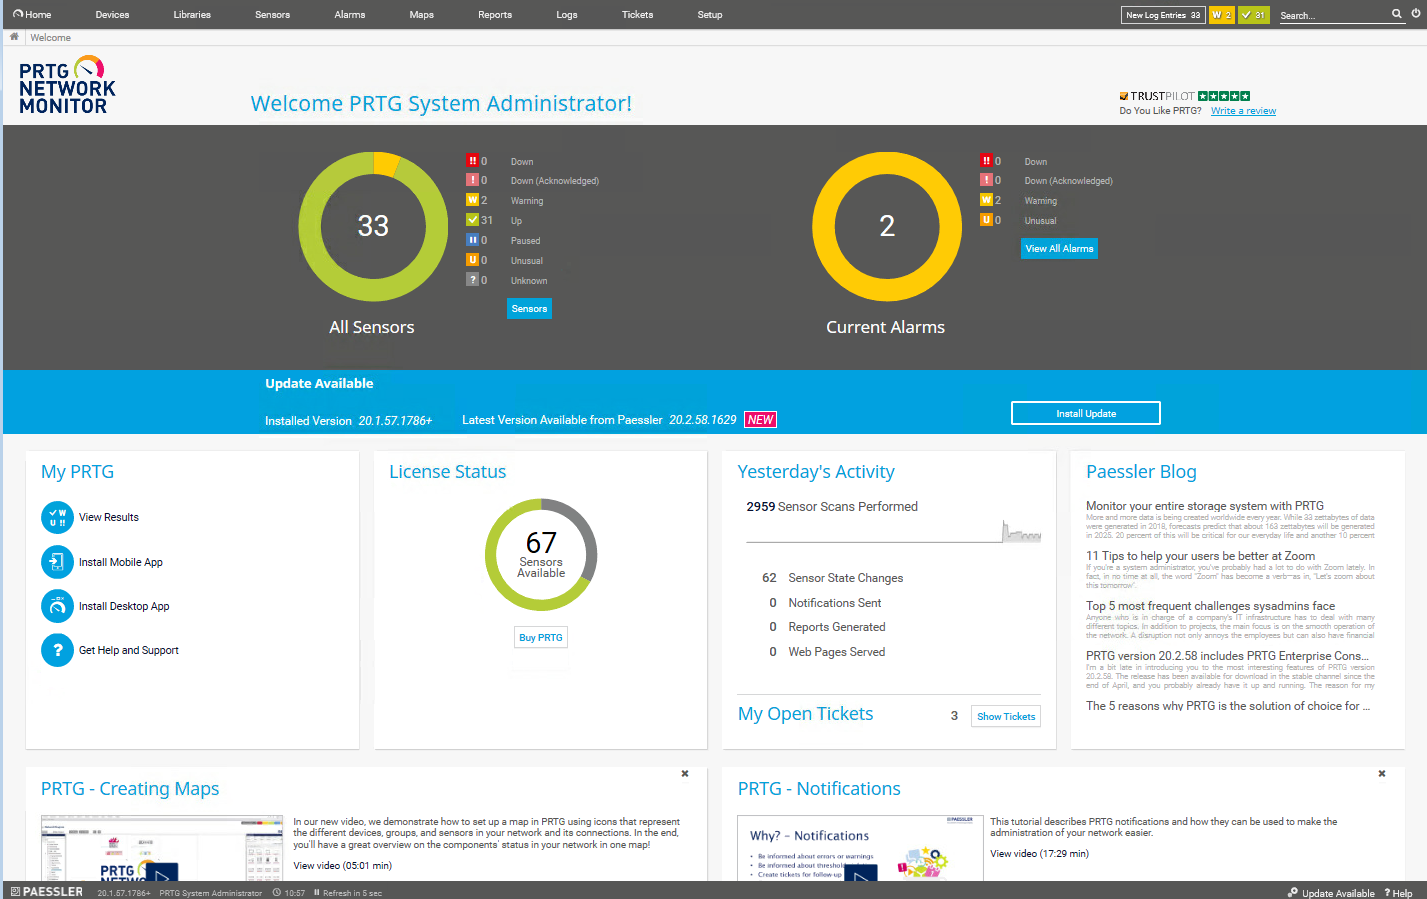
PRTG Network Monitor’s welcome page shows a quick overview of sensor status
PRTG Network Monitor is a professional server monitoring software solution that allows you to monitor your GIS server infrastructure using a collection of “sensors”. CPU usage on a server is a sensor. RAM usage on a server is a sensor. A database’s query response time is a sensor. Drive space usage is a sensor. Checking an individual map service for up/down status is a sensor. PRTG offers dozens of built-in sensor types, such as HTTP sensors, port sensors, bandwidth monitoring sensors, system health (CPU, RAM, Disk) sensors, and many others. While none of the sensors are GIS-specific, many of them can be configured to perform almost any monitoring activities that are important for GIS Server sites, such as monitoring the up/down status of individual map services’ REST endpoints. Sensors are licensed in blocks that are reasonably priced, and the first 100 sensors are included for free. For small ArcGIS Enterprise installations, 100 sensors may be all you need.
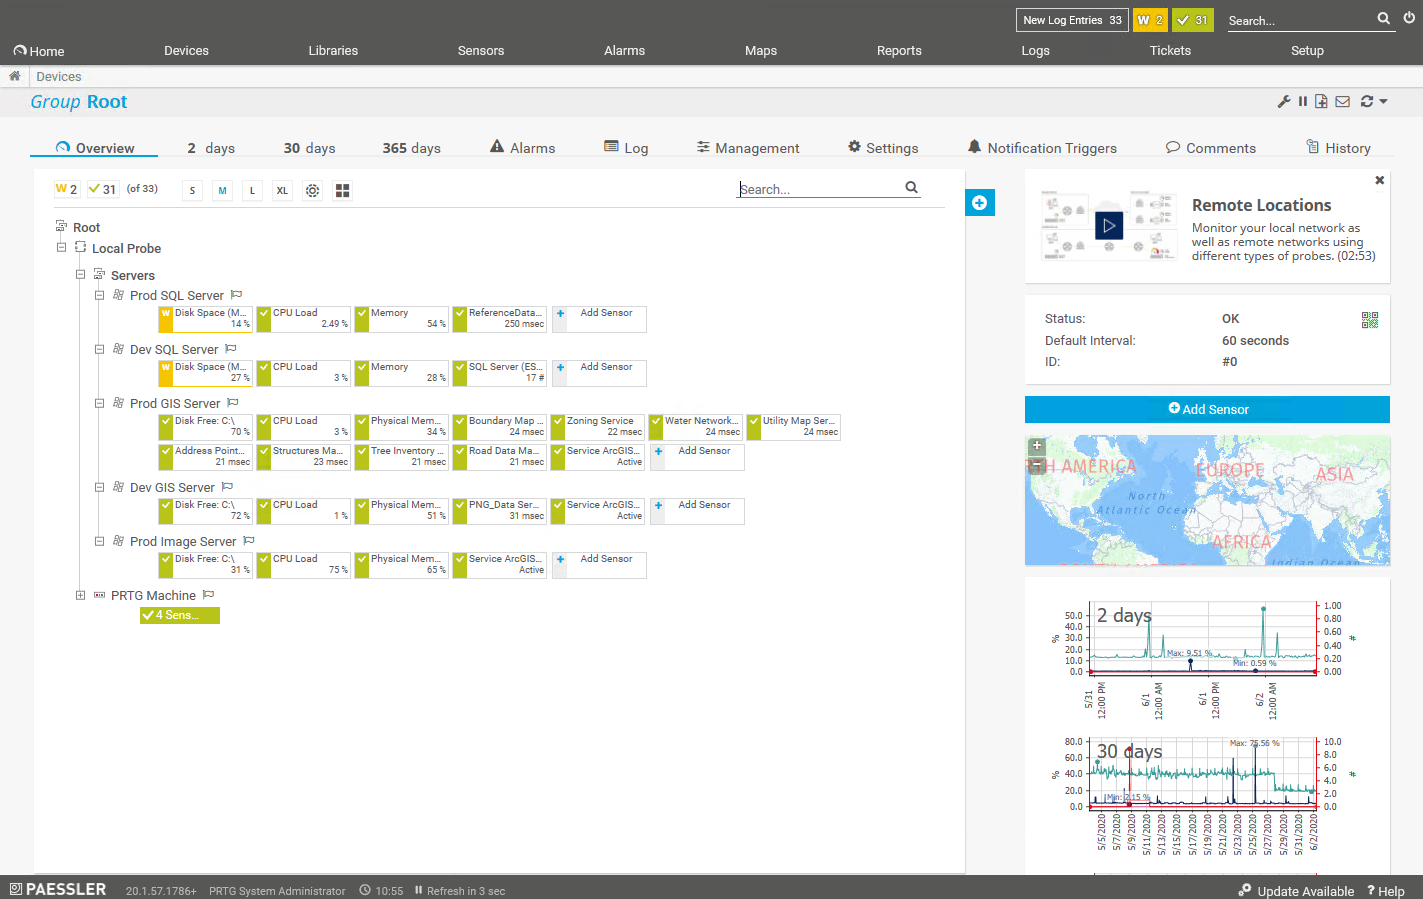
PRTG’s Device Overview page for viewing all currently configured sensors
In addition to a wide variety of sensor types available, PRTG offers automatic notification and alerting via email or by text message. Alerts can be configured for each sensor and the values at which notifications are sent are also configurable. Reports can be generated and exported as PDF files for sharing with others in your organization. Perhaps the most interesting and engaging way to interact with server monitoring data collected by PRTG is using customizable live dashboards, called “maps”.
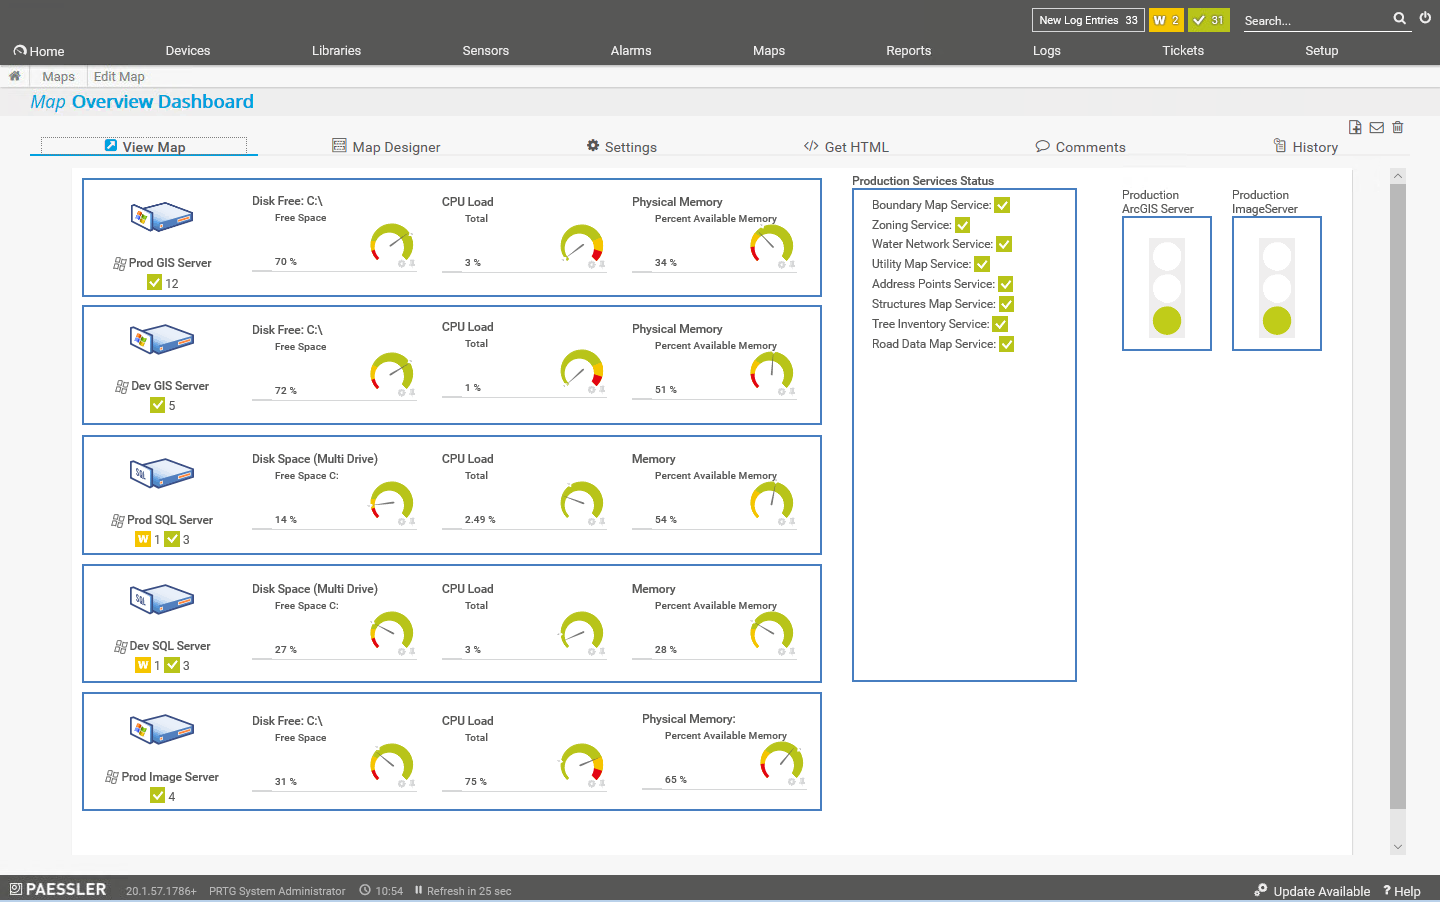
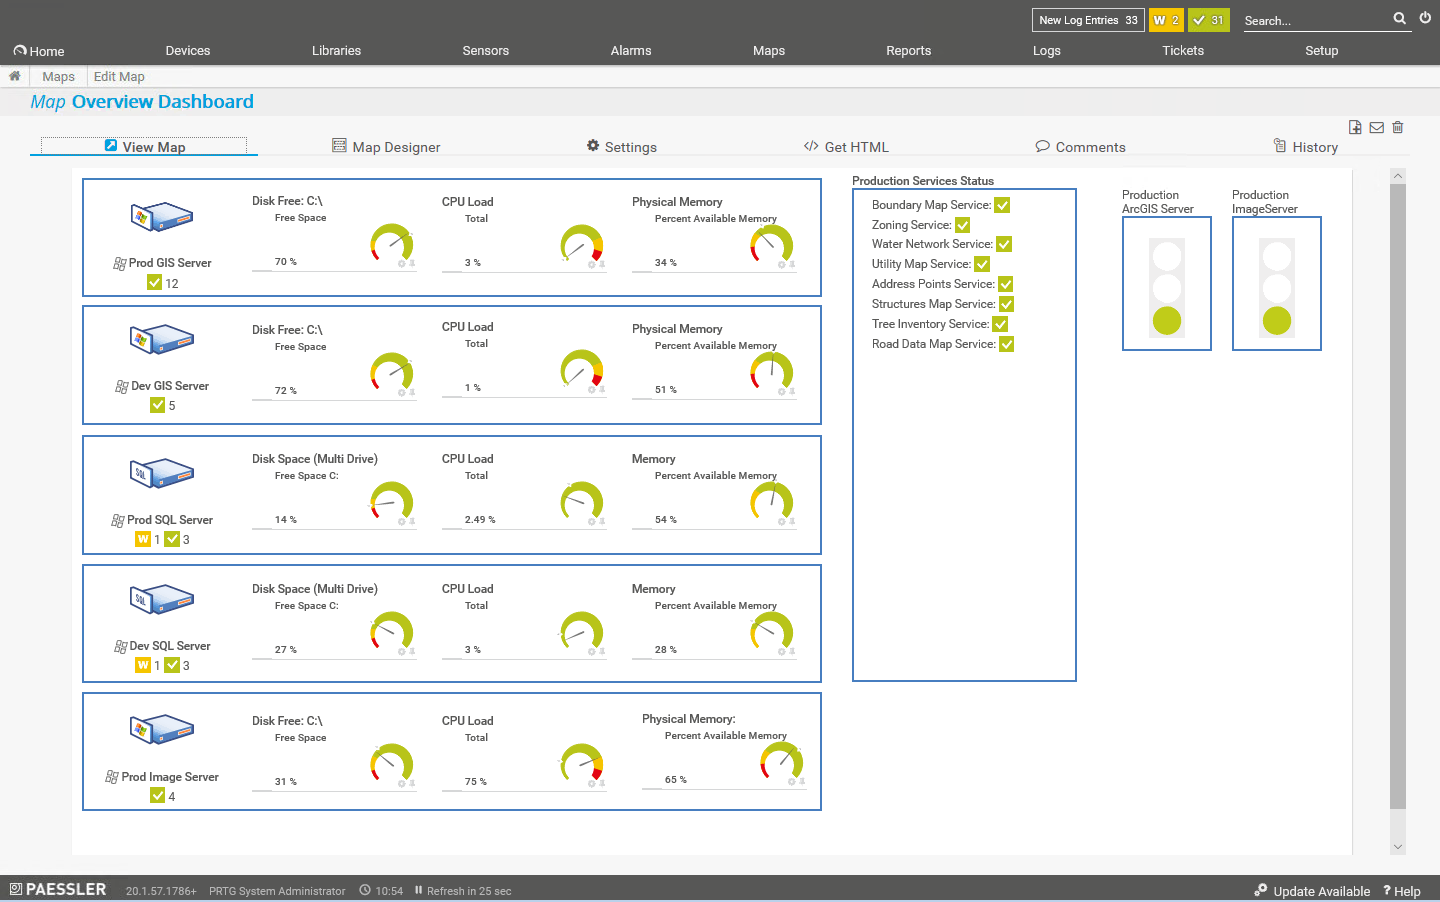
PRTG Map (dashboard) overview showing live monitoring data for five servers and several map services
Maps in PRTG are real-time, customizable overview dashboards that show collected data. These maps can be configured pretty much however you choose and show data using graphs, icons, and tables. Maps can also contain links to other maps so you can construct a suite of dashboards that allow users to see either quick overviews or dig in deeper for more detailed views of system health. Maps can also be shared via web browser URLs so that other stakeholders such as managers can view information about your ArcGIS Enterprise installation and evaluate if sufficient resources have been allocated.
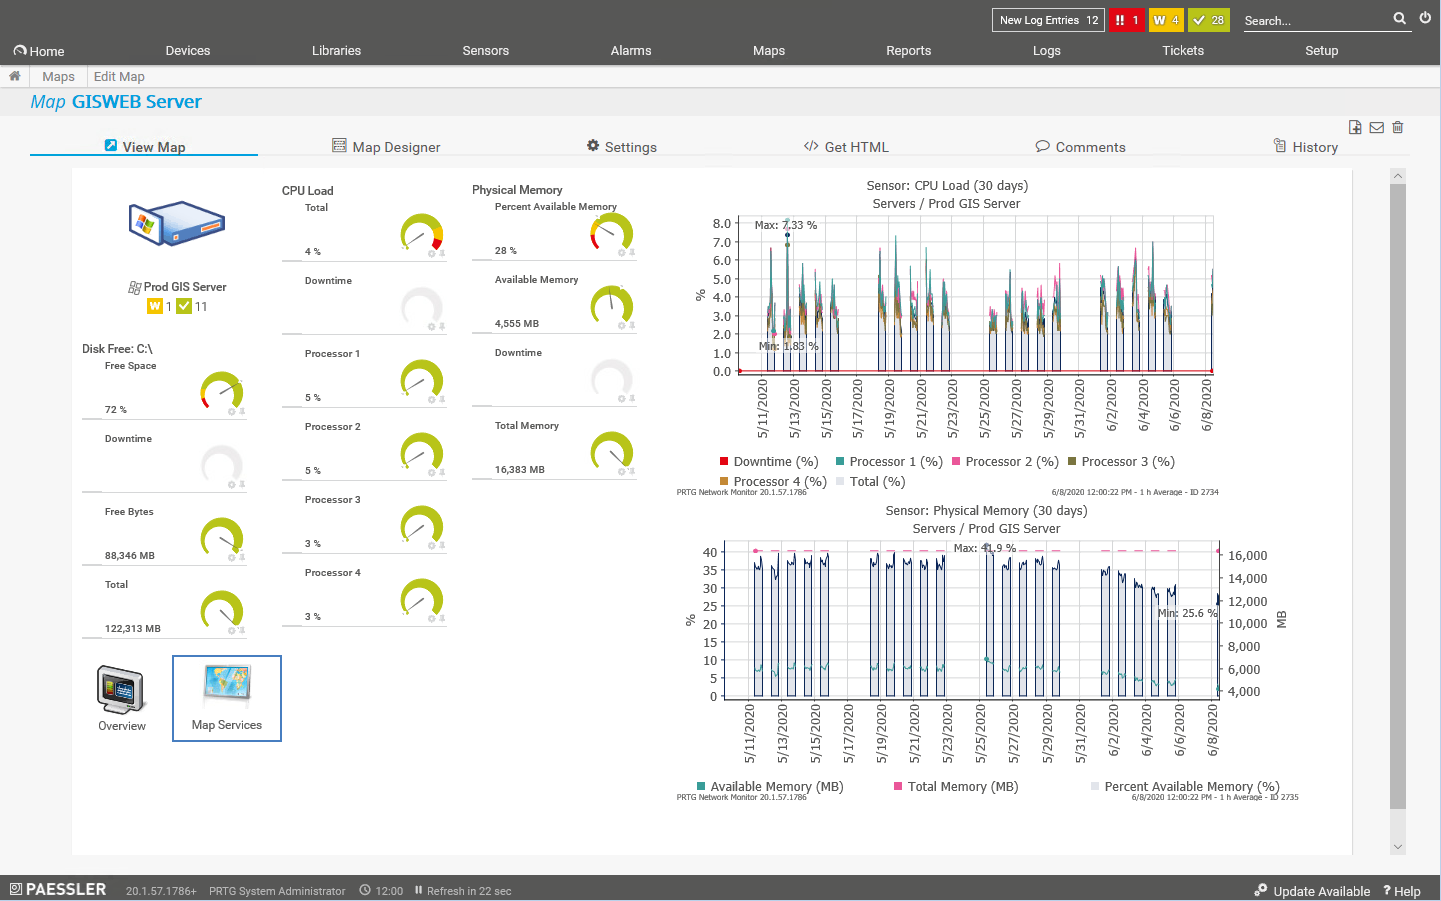
PRTG Map showing the status of one ArcGIS Server machine
Additional Guidance
We hope this article has provided some value to you! If you ever need additional help, don't hesitate to reach out to the Axim team.


